 BlueCL
Market observations
The backend collects public economy observations and stores historical snapshots. Displayed prices are observations, not guaranteed execution prices.

POE2 Exchange brings item prices, historical charts, exchange volume and time-of-week patterns into one dashboard. Short summaries help players interpret the observations beside the charts.
Development complete
Open the dashboard and select the league you play in.
Search for an item, then compare the price chart and exchange information.
Review weekday/hour patterns and sample counts alongside the summary.
Explore the interface, then open the service, source code or demo using the links above. Select an image to see it in full.
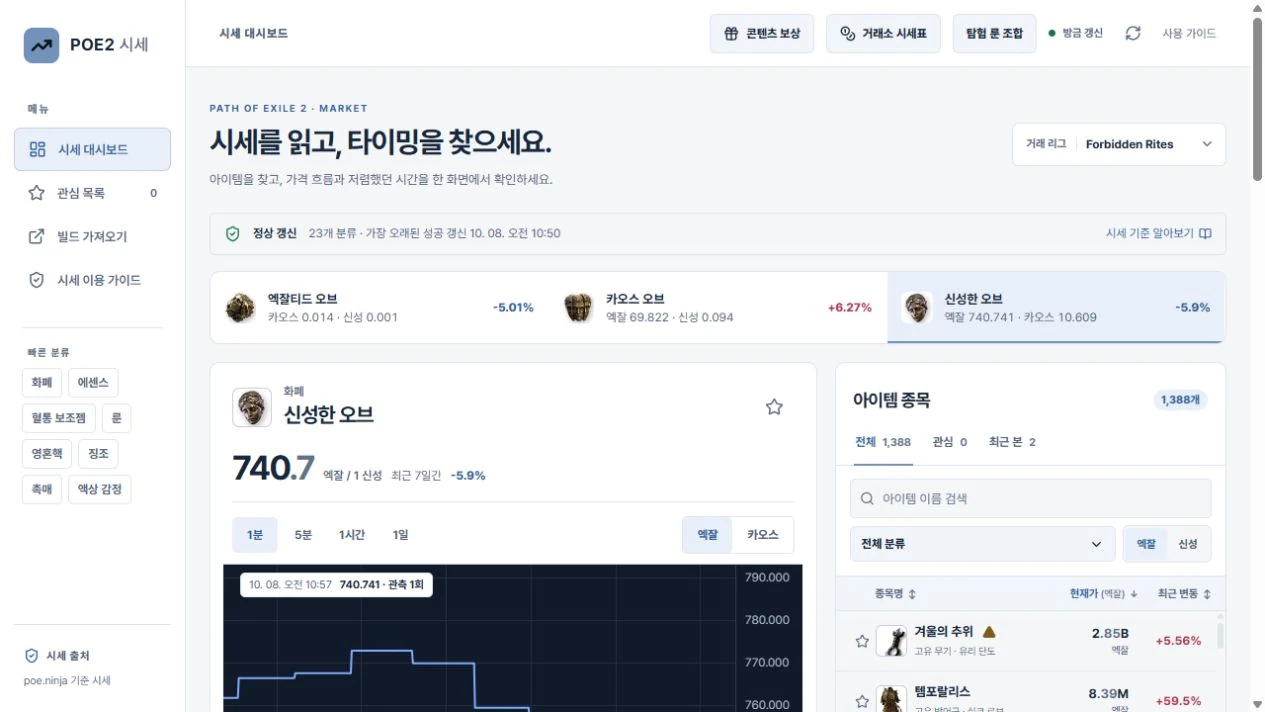
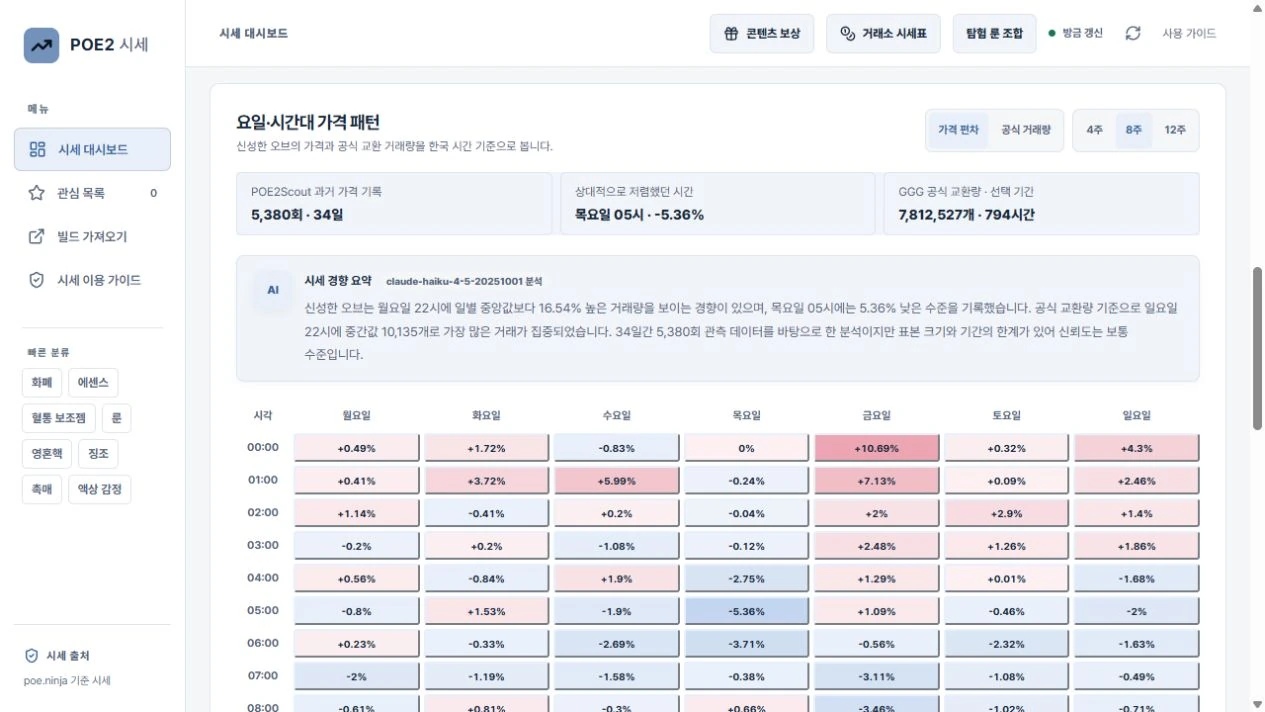
The backend collects public economy observations and stores historical snapshots. Displayed prices are observations, not guaranteed execution prices.
The summary request sends the selected item name and computed statistics to the model provider. The output explains recorded observations.
This is product usage guidance. The BlueCL website privacy notice covers this company website; consult the service’s own documentation for its deployed data handling. Website privacy ↗
Players need to compare price observations and exchange activity across multiple sources. A chart can show movement, but understanding the sampling period, relative price patterns and volume concentration still takes work.
After aggregation, /api/market-summary sends the item name and computed statistics to Claude Haiku 4.5 for a short Korean explanation. The model is configurable through CLAUDE_MODEL. Collection and chart calculations use application code.
The implementation prepares a statistical summary first. If the Claude key is absent or the API request fails, that summary is returned instead. The prompt asks for observed tendencies and sample limits and excludes future-price predictions. Source price snapshots are kept separate from official exchange-volume records.
Evaluate summary faithfulness against the supplied statistics, improve data freshness visibility, and measure summary latency and API cost.
They are sampled reference observations. Check freshness, source and liquidity context before interpreting them.
The time-pattern view compares observations relative to each day’s median. Read the sample counts and observation period with it.
The implementation returns its statistical summary as a fallback.
Product and source information updated: October 8, 2026